# Getting Started
Let's get started with Chart.js!
* **[Follow a step-by-step guide](./usage) to get up to speed with Chart.js**
* [Install Chart.js](./installation) from npm or a CDN
* [Integrate Chart.js](./integration) with bundlers, loaders, and front-end frameworks
* [Use Chart.js from Node.js](./using-from-node-js)
Alternatively, see the example below or check [samples](../samples).
## Create a Chart
In this example, we create a bar chart for a single dataset and render it on an HTML page. Add this code snippet to your page:
```html
```
You should get a chart like this:
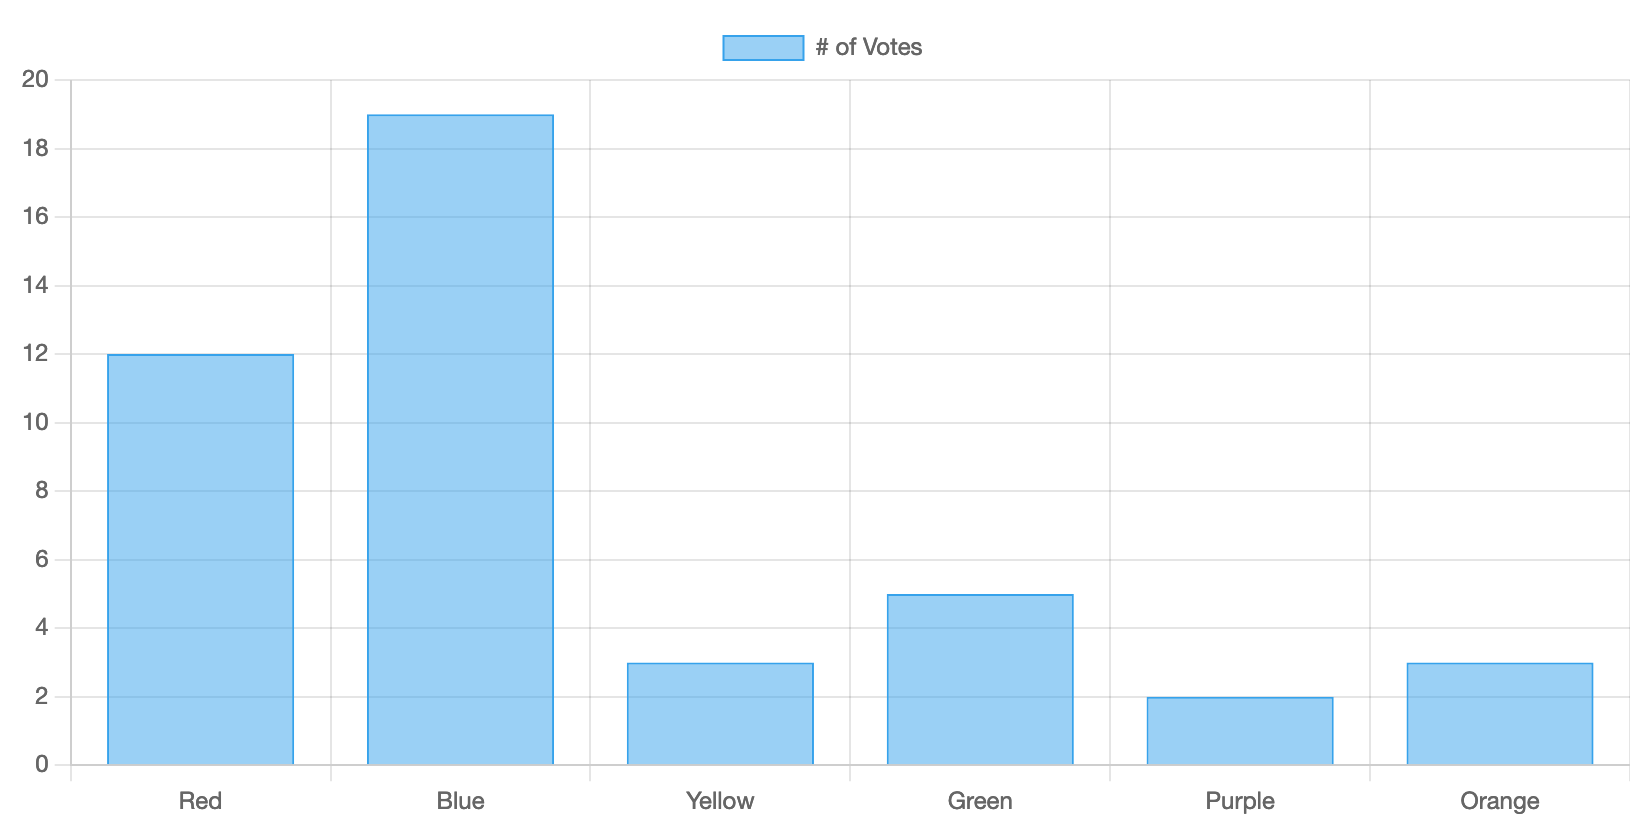
Let's break this code down.
First, we need to have a canvas in our page. It's recommended to give the chart its own container for [responsiveness](../configuration/responsive.md).
```html
```
Now that we have a canvas, we can include Chart.js from a CDN.
```html
```
Finally, we can create a chart. We add a script that acquires the `myChart` canvas element and instantiates `new Chart` with desired configuration: `bar` chart type, labels, data points, and options.
```html
```
You can see all the ways to use Chart.js in the [step-by-step guide](./usage).